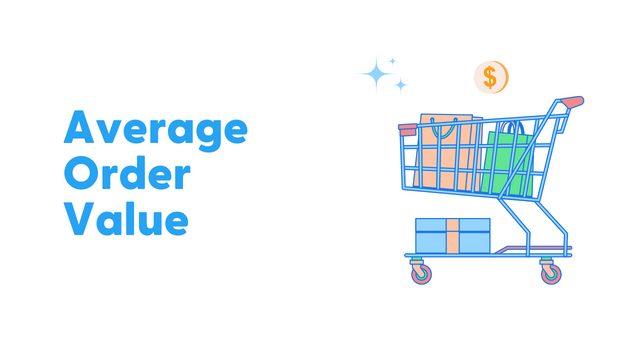
AOV stands for Average Order Value, a metric used to measure the average revenue generated per transaction or order placed on an eCommerce website or platform. It is calculated by dividing the total revenue by the number of orders.
AOV is important in eCommerce because it can indicate the effectiveness of a company’s pricing strategy and marketing efforts.
A high AOV suggests that customers purchase more expensive items or add more items to their cart per transaction. This can also indicate that the company is effectively upselling and cross-selling products.
A high AOV can help to increase profitability, as it can boost revenue without a corresponding increase in the number of orders. Companies can use AOV to identify trends and optimize their sales and marketing strategies to increase revenue.
How to Calculate AOV
The formula for calculating average order value is:
AOV = Total Revenue / Number of Orders
For example, if a business generated $10,000 in revenue from 100 orders, the AOV would be $100 ($10,000 / 100).
AOV is a useful metric for understanding the value of a customer and for setting sales and marketing goals, but it can be affected by various factors such as seasonality, discounts, promotions, and product mix. Therefore, it’s important to consider other metrics, such as customer lifetime value (CLV) and conversion rate, when evaluating the performance of an eCommerce brand.
Methods for Calculating AOV
There are a few different ways to calculate AOV, including:
- Total revenue divided by the number of transactions: For example, if a store generated $10,000 in revenue and had 500 transactions, the AOV would be $20 ($10,000 / 500).
- Total revenue divided by the number of customers: For example, if a store generated $10,000 in revenue and had 250 customers, the AOV would be $40 ($10,000 / 250).
- Sum of all individual order totals divided by the number of transactions: For example, if a store had the following transactions: $100, $50, $75, $25, the AOV would be $50 ( ($100+$50+$75+$25) /4 ).
- Sum of all individual order totals divided by the number of customers: For example, if a store had the following transactions: $100, $50, $75, $25 and 2 customers, the AOV would be $75 ( ($100+$50+$75+$25) /2 ).
It’s important to note that AOV can vary greatly depending on the type of business and the products or services offered. Retail businesses tend to have lower AOVs than service-based businesses, and businesses that sell higher-priced items will have higher AOVs than those that sell lower-priced items.
Importance of Accurate AOV Calculation
Accurate calculation of the average order value (AOV) is important for several reasons:
- It can help businesses understand their customer behavior and spending patterns, which can inform decisions about sales and marketing strategies.
- it can be used to measure the effectiveness of specific promotions or sales.
- Accurate AOV calculation can also help online marketplaces and retailers understand their profitability, as it can be used to project revenue and make budgeting decisions.
- AOV is a key metric for determining the lifetime value of a customer, which helps companies understand the value of their customer base.
Also, read:
Understanding Average Order Value
A high AOV is generally seen as a positive sign for a business, as it suggests that customers spend more money per transaction. However, it is important to note that a small number of high-value orders can artificially inflate a high AOV. For example, if a business has 100 orders and total revenue of $10,000, the AOV would be $100. But if one of those orders was for $1,000, the AOV would still be $100, even though most orders were for much less.
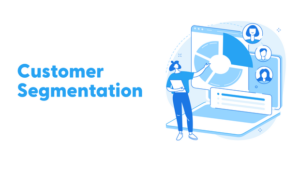
To get a more accurate picture of AOV, it can be useful to segment the data by customer demographics, purchase history, or other factors. This allows you to identify which segments of customers tend to have higher AOVs, and which segments tend to have lower AOVs. Once you have this information, you can focus your efforts on increasing AOV for the segments with the highest potential for growth.
For example, if you find that customers who have made multiple purchases in the past tend to have higher AOVs, you could focus on strategies to encourage repeat purchases, such as loyalty programs or targeted upselling. On the other hand, if you find that new customers tend to have lower AOVs, you could focus on strategies to convert them into repeat customers, such as email marketing campaigns or targeted promotions.
It is important not to just look at the overall AOV number. Segmenting the data and understanding the AOV for the biggest segments can help identify growth and optimization opportunities.
Also, read:
Optimizing AOV
Optimizing AOV can help businesses increase revenue and improve their bottom line.
10 Best Practices and Strategies for AOV Optimization
- Cross-selling and upselling: Encourage customers to purchase complementary or higher-priced products by highlighting them during checkout or through targeted email campaigns.
- Free shipping threshold: Offer free shipping on orders over a certain amount to incentivize customers to add more items to their cart.
- Bundle deals: Offer discounted prices for buying multiple items together.
- Discounts and promotions: Offer special discounts or promotions to encourage customers to make larger purchases.
- Personalized recommendations: Use customer data to recommend products that match their interests and browsing history, increasing their chances of purchasing. Also, read – Customer Data Platform
- Limited-time offers: Create a sense of urgency by offering time-limited deals or promotions.
- Optimize checkout process: Make sure the checkout process is easy to navigate and minimize the number of steps required to complete a purchase. Read more – Shopping Cart Abandonment
- Improve product descriptions and images: Provide detailed and high-quality product information to help customers make informed purchasing decisions.
- Optimize mobile experience: Improve the mobile experience to make it easy for customers to browse and purchase products on their smartphones. Read more – Conversion Rate Optimization
- Deliver exceptional customer service: Improve customer satisfaction by providing fast and friendly customer service, which can increase the likelihood of repeat purchases.
Optimizing AOV should not come at the expense of other important metrics such as customer acquisition cost and conversion rate. A balance should be struck to ensure that overall business performance is improved.
An easy-to-understand example of successful AOV optimization is Amazon’s “Frequently Bought Together” feature. This feature suggests additional products to customers that are often purchased together with the item they are currently viewing. By making these suggestions, Amazon increases the likelihood that customers will add more items to their cart, thus increasing the AOV.
Average Order Value Benchmarking
Benchmarking AOV (Average Order Value) is important because it helps businesses understand how their sales performance compares to industry standards and competitors. By setting benchmarks, businesses can identify areas for improvement and track progress over time.
Industry standards for AOV vary depending on the industry and product type. For example, in eCommerce, the average AOV is around $80-100, while retail can be around $60. It is important to research industry averages for your specific business to establish a benchmark for your own AOV.
To compare AOV to competitors, you can research their AOV by looking at public financial statements or by using market research tools. You can also use tools such as Google Analytics or Shopify analytics to track your own AOV over time and compare it to your competitors. You can also look at other metrics, such as conversion rate and customer lifetime value to better understand how your business compares to competitors. Additionally, you can research their pricing strategies, product offerings, and marketing tactics to identify areas where you can improve. It’s also important to consider the context of your industry and target market to understand how relevant the comparison is.
Relationship between AOV and other Metrics
AOV is closely related to other metrics such as conversion rate, customer acquisition cost, and customer lifetime value. Conversion rate is the percentage of visitors to a website who make a purchase and is calculated by dividing the number of conversions by the number of visitors. A higher conversion rate can lead to a higher AOV if the conversion is for a higher-priced product.
Customer lifetime value (CLV) is the total revenue generated by a customer over the entire lifetime of their relationship with a business. CLV is important because it helps businesses understand the value of acquiring and retaining customers. A higher CLV can lead to a higher AOV if the customer is purchasing higher-priced products or purchasing more frequently.
The AOV (average order value) to CAC (customer acquisition cost) ratio is a metric that compares the revenue generated from a customer to the cost of acquiring that customer. A higher ratio indicates that a business generates more revenue from each customer than it spends to acquire them.
The CAC: LTV (lifetime value) ratio, on the other hand, compares the cost of acquiring a customer to the total revenue that the customer generates over their lifetime. A lower ratio indicates that a business is spending less on acquiring a customer than the revenue generated by the customer.
Example: A business has an AOV of $100 and a CAC of $50. The AOV: CAC ratio is 2:1 (100/50). This indicates that the business generates $2 in revenue for every $1 spent on acquiring customers.
If the LTV of that customer is $1000, then the CAC: LTV ratio is 0.05 (50/1000), which means the business is spending $0.05 to acquire a customer whose lifetime value is $1.
Businesses can improve profitability by using cohort analysis to identify patterns and trends in customer behavior. For example, analyzing data on customer acquisition and revenue by month or year can help a business identify which acquisition strategies are most effective and which customers are most valuable. Businesses can then focus their resources on acquiring more customers, like the most valuable ones, and adjust their strategies accordingly.
Using Cohort Analysis to Maximize Profitability
Cohort analysis in eCommerce involves grouping customers based on their acquisition date, and then tracking their behavior over time. This allows businesses to understand how customer behavior changes over the course of their lifetime and make more informed decisions about how to retain and monetize their customer base.
One key aspect of cohort analysis in ecommerce is tracking customer behavior over a specific time period, such as 60 days or one year. This is because customer behavior can change significantly over time, and tracking customers over a longer period can provide a more accurate picture of their lifetime value.
For example, a customer who makes a large purchase in their first month may not be as valuable in the long term as a customer who makes smaller, consistent purchases over time. By tracking customer behavior over a 60-day or one-year period, businesses can better understand which customers are most valuable and how their behavior changes over time.
A 60-day period is considered a critical time frame to understand customer behavior because it is a short enough period to capture the initial impact of a customer acquisition strategy, but long enough to see if the customer is profitable for the business. In this period, a business can see if the customer is likely to be a repeat customer or not, if the acquisition cost has paid off or not.
Similarly, a one-year period is important because it allows businesses to see how customer behavior changes over time and make more accurate forecasts and projections. In this period, businesses can see how a customer’s lifetime value evolves and make decisions based on that.
Conclusion
In conclusion, AOV is a crucial metric for understanding your business’s performance, but it is just one piece of the puzzle. To truly understand your customers, acquisition costs, lifetime value, and conversion rates, it is essential to have a comprehensive data platform in place.
At Saras Analytics, we can help you set up a modern data stack for automated customer behavior insights and cohort analysis, enabling you to make data-driven decisions and drive profitability. Contact us today to learn more about how we can help you take your business to the next level.