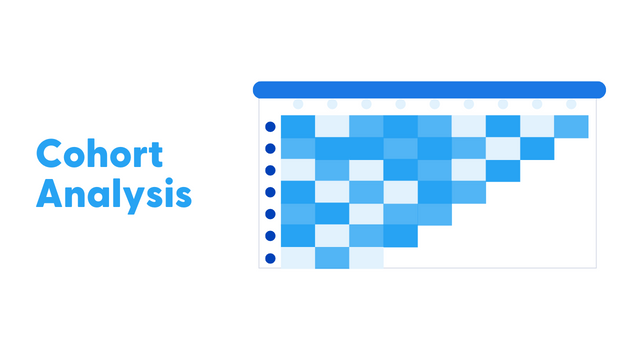
Cohort analysis is a method of analyzing data that involves grouping users or customers into groups or “cohorts” based on shared characteristics or behaviors. This can be used to track changes in behavior or engagement over time, and to identify trends or patterns that may not be apparent when looking at data for the entire user or customer base.
Cohort analysis can be used in various contexts, including eCommerce, digital marketing, and product development. Some common use cases for cohort analysis include:
- Identifying trends in customer behavior: By analyzing data for different cohort groups, you can identify trends in customer behavior over time, such as changes in purchase frequency or average order value.
- Identifying retention trends: Cohort analysis can be used to track retention rates over time, helping you understand how well you are retaining your customers and identifying opportunities to improve retention.
- Identifying product or feature adoption: Cohort analysis can be used to track the adoption of new products or features, helping you understand how well your customers are receiving them and identify any issues that may be preventing adoption.
- Identifying customer segments: By analyzing data for different cohort groups, you can identify distinct customer segments and understand their behaviors and preferences.
To perform cohort analysis, you will need to have a customer data platform or access to data on your customers or users, including information on their behaviors or actions over time. This data can be analyzed using various tools and techniques, such as spreadsheet software or specialized analytics platforms.
Types of Cohort Analysis
Let’s look at five common types of cohort analysis, along with examples:
- Time-based cohort analysis: This type of analysis groups individuals based on the time period in which they first became customers or users. This can be useful for identifying patterns in customer retention or spending habits over time. For example, a company might use time-based cohort analysis to track the purchasing behavior of customers who first made a purchase in January versus those who first made a purchase in February.
- Event-based cohort analysis: This type of analysis groups individuals based on a specific event or action. This can be useful for identifying patterns in behavior or engagement following a particular event. For example, a company might use event-based cohort analysis to track the behavior of users who first signed up for a service during a promotional event versus those who signed up at other times.
- Size-based cohort analysis: This type of analysis groups individuals based on their initial purchase or investment size. This can be useful for identifying patterns in customer behavior or spending habits among different segments of customers. For example, a company might use size-based cohort analysis to track the purchasing behavior of customers who made a small initial purchase versus those who made a large initial purchase.
- Behavioral-based cohort analysis: This type of analysis groups individuals based on specific behaviors or actions they have taken. This can be useful for identifying patterns in behavior or engagement among different segments of users. For example, a company might use cohort analysis to track the behavior of users who frequently engage with the company’s social media accounts versus those who do not.
- Funnel-based cohort analysis: This type of analysis groups individuals based on the stages of a funnel. This can be useful for identifying patterns in behavior or engagement among different segments of users. For example, a company might use funnel-based cohort analysis to track the behavior of users who abandoned their cart during the checkout process versus those who completed the purchase.
Data and Metrics used in Cohort Analysis
The goal of cohort analysis is to understand how the identified cohorts evolve over time and identify any patterns or trends that can be used to inform business decisions.
Data sources for cohort analysis can include customer databases, website analytics, and other sources of customer behavior data. The data collection methods will vary depending on the data sources used, but may include web scraping, APIs, or manual data entry.
Read more: Modern Data Stack
Once the data has been collected, it is typically organized by cohort, with each row representing an individual and each column representing a metric of interest. Some common metrics used in cohort analysis include:
- Retention rate: the percentage of individuals in a cohort who continue to engage with the product or service over a given period. This can be used to understand how well a product or service retains customers over time.
- Customer Lifetime value (CLV): an estimate of the total revenue a customer will generate over the course of their lifetime. This can be used to understand the long-term value of a customer and inform marketing and acquisition strategies.
- Purchase frequency: the number of purchases an individual makes over a given period. This can be used to understand how often customers make purchases and identify seasonal and other trends.
- Churn rate: the percentage of individuals in a cohort who stop using the product or service over a given period. This is the opposite of the retention rate and can be used to understand why customers are leaving and identify areas for improvement.
- Acquisition cost: the cost of acquiring a new customer. This metric can be used to understand the ROI of different acquisition strategies and identify the most cost-effective strategies.
- Revenue per user (RPU): the average revenue generated by an individual in a cohort. This metric can be used to understand how much revenue is being generated by different segments of customers and identify areas for growth.
- Average order value (AOV): the average value of an individual’s purchases. This metric can be used to understand the value of different segments of customers and identify opportunities for upselling or cross-selling.
It is important to note that, depending on the business model, industry, and product or service, other metrics may be more relevant or important to track. For example, for a subscription-based business, metrics such as the number of subscribers, subscriber churn rate, and subscriber lifetime value may be more important than metrics such as purchase frequency or average order value.
Read more: Subscription Analytics
Additionally, cohort analysis is not only limited to analyzing customer data but can also be used to analyze any kind of data that can be grouped by a shared characteristic such as time, location, or event.
It’s also worth noting that cohort analysis can be applied at different levels of granularity, for example, you can analyze data at the day, week, month, quarter, or year level, depending on the business case and the data availability.
How can Cohort Analysis help Different Business Functions
Cohort analysis is valuable for business functions. Here are a few examples of how cohort analysis can be used to support different business functions:
| Business Function | Group By | To Track |
| Marketing | Month of First Engagement | Changes in engagement or conversion over time, trends or patterns in user behavior |
| Finance | Month of First Purchase | Changes in financial metrics (revenue, profitability, customer acquisition cost) over time, trends or patterns in customer behavior |
| Sales | Month of First Purchase | Changes in purchase frequency and average order value over time, trends or patterns in customer behavior; insights to optimize sales strategy and improve performance |
| Customer Service | Month of First Reported Issue | Time taken to resolve customer issues, trends in customer satisfaction |
| Product Development | Month of First Use of New Product or Feature | Adoption of new products or features over time, trends or patterns in user behavior, identification of issues preventing widespread adoption. |
- Marketing: Using cohort analysis, businesses can do data-driven marketing. By grouping customers or users by the month in which they first engaged with the brand, marketers can track changes in engagement or conversion over time and identify trends or patterns that may not be apparent when looking at data for the entire user base. This can aid the marketing analytics initiatives.
- Finance: Finance teams can use cohort analysis to track changes in financial metrics such as revenue, profitability, or customer acquisition cost (CAC). By grouping customers or users by the month in which they made their first purchase, finance teams can track changes in these metrics over time and identify trends or patterns that may not be apparent when looking at data for the entire customer base. This can help finance teams optimize their financial strategy and make informed decisions about resource allocation.
- Sales: By grouping customers or users by the month in which they made their first purchase, sales teams can track changes in purchase frequency and average order value over time and identify trends or patterns that may not be apparent when looking at data for the entire customer base. This can help sales teams understand how well their products or services perform and identify opportunities to improve sales.
Based on the insights gained from cohort analysis, sales teams can optimize their sales strategy to improve performance. This could involve adjusting the focus of sales efforts, experimenting with different pricing or product offerings, or testing different sales tactics. - Customer service: Customer service teams can use cohort analysis to track the resolution of customer issues over time. By grouping customers by the month in which they first reported an issue, customer service teams can track the time it took to resolve the issue and identify trends in customer satisfaction. This can help customer service teams optimize their processes and improve the customer experience.
- Product development: Product development teams can use cohort analysis to track the adoption of new products or features. By grouping users by the month in which they first started using a new product or feature, product development teams can track usage over time and identify trends or patterns in adoption. This can help product development teams understand how well new products or features are being received and identify any issues that may be preventing widespread adoption.
Cohort Analysis Examples
- eCommerce: A retailer could use cohort analysis to track changes in customer behavior over time, such as changes in purchase frequency or average order value. For example, the retailer might group customers by the month in which they made their first purchase and track their behavior over the following months. This could help the retailer identify trends in customer behavior and identify opportunities to improve retention or encourage repeat purchases.
- Subscription Businesses: Cohort analysis is useful for analyzing customer acquisition cost (CAC) and lifetime value (LTV). Here are a few ways you might use cohort analysis as part of subscription analytics:
- Identifying trends in CAC and LTV: By grouping customers into cohorts based on the month in which they made their first purchase, you can track changes in CAC and customer lifetime value over time. This can help you identify trends or patterns in these metrics and understand how they are impacted by factors such as marketing spend, customer acquisition channels, and product pricing.
- Comparing CAC and LTV for different cohort groups: By comparing CAC and LTV for different cohort groups, you can identify any differences in these metrics between groups. For example, you might compare the CAC and LTV for customers acquired through different channels, or for customers in different geographic regions. This can help you understand which customer segments are the most valuable to your business and identify opportunities to optimize your acquisition efforts.
- Optimizing CAC and LTV: By analyzing CAC and LTV data for different cohort groups, you can identify opportunities to optimize these metrics. For example, you might find that customers acquired through certain channels have a higher LTV, and adjust your marketing spend accordingly. You might also identify opportunities to improve customer retention or increase customer spend, which can help increase LTV.
- Digital marketing: A digital marketing team could use cohort analysis to track the effectiveness of different campaigns or marketing channels. For example, they could group users by the month in which they first engaged with the brand and track their behavior over time. This could help the team identify trends in engagement or conversion and optimize their marketing efforts accordingly.
Cohort Analysis to Increase Profitability
Cohort analysis can be used to calculate and increase profitability by tracking changes in financial metrics over time. Here’s how it works:
- Define your cohort groups: First, you will need to define the cohort groups that you want to analyze. This could be based on several factors, such as the month in which customers made their first purchase, the channel through which they were acquired, or the product they purchased.
- Calculate profitability: Next, you will need to calculate profitability for each cohort group. To do this, you will need to track the revenue and expenses associated with each group over time. This could include things like the cost of acquiring the customer, the cost of fulfilling orders, and any other relevant expenses. By subtracting the expenses from the revenue, you can calculate the profitability of each cohort group.
- Analyze the data: Once you have calculated profitability for each cohort group, you can use cohort analysis to track changes in profitability over time. This could help you identify trends or patterns in your business’s performance and identify opportunities to improve profitability.
- Optimize your business strategy: Based on your analysis, you can make changes to your business strategy to optimize profitability. This could involve adjusting your pricing, experimenting with different product or service offerings, or changing your cost structure.
By using cohort analysis to track profitability, you can gain a deeper understanding of the performance of your business and identify opportunities to accelerate your growth.
Challenges in Cohort Analysis
Several challenges make it difficult to conduct effective cohort analysis:
- Data availability: To conduct a cohort analysis, you need a large amount of data. This can be a challenge if your business does not have the resources to collect and store large amounts of data.
- Lack of granularity: To get the most out of cohort analysis, you need highly granular data. This can be difficult to achieve if the data you have is not very detailed or if it is not collected in a way that makes it easy to break down into smaller groups.
- Lack of data infrastructure: Conducting a cohort analysis requires a robust data infrastructure that can handle large amounts of data and perform complex calculations. Without the right infrastructure, it can be difficult to analyze the data effectively.
- Lack of historical data: Cohort analysis typically looks at historical data to understand customer behavior over time. If your business does not have a lot of historical data, it can be difficult to conduct a meaningful analysis.
- Data quality issues: Poor data quality can make it difficult to conduct accurate analysis. This can include missing data, incorrect data, or data that is not in a format that can be easily analyzed.
- Difficulty in identifying the appropriate cohort: Identifying the appropriate cohort for analysis is essential for getting accurate and meaningful insights. However, this can be challenging, especially when dealing with large datasets.
- Difficulty in interpreting the results: Cohort analysis can produce a lot of data, and it can be difficult to interpret the results and turn them into actionable insights.
How to do Cohort Analysis using GA 4
Google Analytics 4 (GA4) offers features that can be used to perform cohort analysis. Here’s how you can use GA4 to perform cohort analysis:
- Set up your cohort groups: In GA4, you can define cohort groups based on various factors, such as the date on which users first engaged with your business, the channel through which they were acquired, or the device they used. To set up your cohort groups, go to the “Audience” section in GA4 and click on the “Cohorts” tab. From here, you can select the dimensions that you want to use to define your cohort groups.
- Collect data: Once you have set up your cohort groups, you can use GA4 to track a variety of metrics for each group, including engagement metrics such as sessions or screen views, conversion metrics such as goal completions or ecommerce transactions, and demographic or behavioral data such as age, gender, or interests.
- Analyze the data: You can use the cohort analysis features in GA4 to track changes in the metrics that you are tracking over time. This could help you identify trends or patterns in your data and understand how different cohort groups behave.
- Optimize your strategy: Based on your analysis, you can use the insights gained from cohort analysis to optimize your marketing and customer acquisition efforts. This could involve adjusting your marketing spend, experimenting with different channels or tactics, or changing your pricing or product offering.
Conclusion
In conclusion, cohort analysis is a valuable tool for businesses to identify their most profitable customers and optimize their marketing and sales efforts. Utilizing a data warehouse and proper tracking analytics can greatly aid in collecting, storing, and analyzing the data necessary for effective cohort analysis.
Saras Analytics has a proven track record of helping brands establish a strong data foundation and effectively utilizing eCommerce data to drive growth and success. If your business wants to improve its data-driven decision-making and customer targeting, contact us to set up and implement a comprehensive cohort analysis strategy.