Reporting and Analytics play a significant role in assessing raw data, transforming it into valuable information, and analytics predict the future performance of an enterprise.
Let’s have a deeper look at what Reporting and Analytics are.
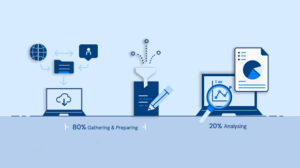
What are Reporting and Analytics
Reporting or data reporting collects and formats raw data and translates it into valuable information to evaluate an organization’s current performance. So, the data reports can answer critical queries about the situation of a business. Above all, these reports can show the current status of information in an Excel file or data visualization tool. Suppose a survey document that conveys vital information about citizens of a specific country like age, gender, occupation, or population. The reporting tool can display the data in a visual format, such as a graph or chart. The companies need data reporting to provide financial information such as revenues, accounts receivables, and net profits.
Analytics or data analytics helps evaluate data sets to detect trends and draw conclusions about a company’s information. It works with the support of specialized systems and software. Therefore, technologies and techniques are broadly used in retail industries to permit corporations to make well-informed business decisions. Scientists and researchers use analytics to verify or disprove scientific models, theories, and hypotheses. Above all, it can guide businesses to grow their revenues, improve operational efficiency, and optimize marketing campaigns and customer service efforts. In short, analytics respond quickly to emerging market trends and gain a competitive edge over rivals.
What is the difference between Reporting and Analytics
| Reporting | Analytics |
| Reporting is the method of collecting, compiling, and organizing data into different formats like charts and graphs. | Analytics prioritizes exploration and interpretation of data or reports to glean valuable insight into why specific trends happened the way they did. |
| Reporting provides an overall assessment of the company’s performance in a report form. | Analytics provides more profound knowledge about the behavior of visitors, leads, or customers. |
| Reporting focuses on what is happening. | Analytics displays why a certain thing is happening. |
| Reporting is about organizing, formatting, and summarizing data. | Analytics is about questioning, interpreting, and exploring information. |
| Reporting pushes outcomes to users for review. | Companies pull results to answer questions. |
| Reporting translates data into information. | It offers recommendations to compel actions. |
| Reporting works on the data. | Analytics works on the context of information or the meaning of the information. |
Real-Life Use-Cases of Reporting and Analytics
Some of the real-life use-cases of reporting are:
- Railways: it uses reports for prevention and control of pollution, management, and conservation of resources, waste management, and several other annual audit reports. Later these reports are used for analytics.
- Corporate sales report: Sales reports consist of data on sales volume, ongoing opportunities, new accounts, revenue, and customer acquisition costs. For example, companies display their quarterly and annual revenue reports. Secondly, these reports are vital for those companies that are listed in the stock market.
- Another example is a road construction project report. It consists of various components like descriptions of roads, pavements, purposes, functions, drainage systems, and types of concrete pavements.
- The bank industry report also comes out with its quarterly and annual revenue reports.
Some of the real-life use-cases of analytics are:
- Cybersecurity – Detection of malware: Analytics uses artificial intelligence while dealing with cybersecurity. It uses a large amount of data and detects the existence of malware before ill-disposed files are opened. It also recognizes types of malware. Cybersecurity is critical because malware remains to evolve beside other advancements, from bots and botnets to ransomware and beyond.
- Wealth management: Advanced analytics to business problems helps provide value to financial services, and qualify managers with data to make quick, sustainable decisions. As a result, businesses are applying data and advanced analytics toward a more data-driven method of sales and marketing.
Top 3 Reporting Tools
The top 3 reporting tools are:
- Zoho Analytics: It is a self-service analytics platform and business intelligence software that guides us to analyze business data efficiently and build insightful reports and dashboards for informed decision-making.
- Microsoft Power BI: It is a cluster of software services, apps, and connectors that operate collectively to turn our unrelated sources of data into unified, visually immersive, and interactive insights.
- Xplenty: It helps to instantly and efficiently prepare data and analytics for migration. It’s also cost-effective, supporting us to decrease preparation time.
Top 3 Analytics Tools
The top 3 analytics tools are:
- Google Analytics: It assists us in maintaining a track of all the content that gets views and shares. As a result, with this data, we can optimize the top viewed blogs to attract consumers more fruitfully.
- Knime: It permits clients to visually build data flows (or pipelines), selectively perform few or all analysis measures, and later examine the outcomes, and models, applying interactive views and widgets. This software is built on Eclipse and written in Java.
- Qlik Sense: Qlik Sense is a self-service tool that focuses on users’ benefits. Therefore, it works as data discovery and analytics tool that provides an interactive user platform for data management and modeling. It helps to create layouts and visualizations.
Conclusion
Reporting and Analytics play a vital role in boosting the performance of enterprises. Reporting collects, compiles, and organizes raw data, and summarizes it into meaningful information. Analytics, on the other hand, extracts meaning from that information. Subsequently, data visualization tools or excel files show the reports for further assessment. For example, several areas that apply reporting and analytics are Railways, corporate sales reports, road construction project reports, bank industry reports, cybersecurity (analytics), and wealth management (analytics). Therefore, the most popular reporting tools are Zoho Analytics, Microsoft Power BI, and Xplenty. The best Analytics tools are Google Analytics, Knime, and Qlik Sense. In addition, these tools help a company create reports, analyze its performance, and predict future sales and marketing needs.
To know more about reporting and analytics,