Executives always look for several reports and insights to understand how their eCommerce business is performing. However, limited technology and data spread across channels always become a hassle to find proper insights. So, executives resort to even more technology to solve their data needs as a last resort.
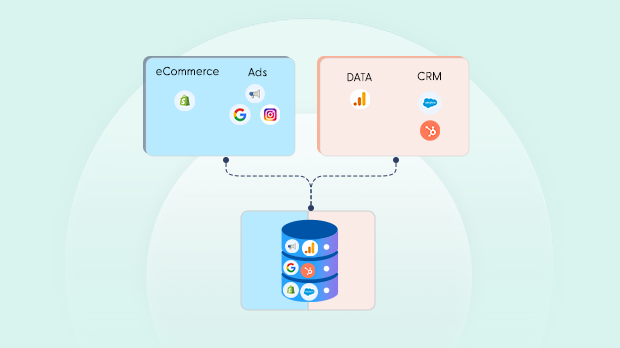
For a typical eCommerce brand, information is spread across multiple channels-
- Customer demographics and customer lifetime value data from CRMs.
- Attribution data containing campaign, channel related information.
- Transaction data of their online stores
- Advertisement spends insights based on the platform.
eCommerce brands now utilize data blending to enhance their marketing reports. Let us learn more about data blending and more concepts in depth.
What is Data Blending?
When many data sets are combined into one, this process is known as “data blending.” For example, you may combine data from many databases like Amazon Redshift, Snowflake, and PostgreSQL to better understand client purchase habits across channels.
You need an ETL or ELT solution like Daton to normalize the information because data from several databases have different formats. After the data has been normalized, it may be sent to its final location.
Understanding Data Joining
Let us say you oversee a digital marketing firm and are considering promoting it with paid social media posts. After finishing the commercials, you should review your results. Your goal should be to identify the source that brings in the most money or the most clicks. You can only get there by combining or integrating your paid advertising data.
On the other hand, you ran an online store ad campaign and are interested in the sales you made. You are interested in tracking which pages are the most popular or which items visitors consider purchasing but did not purchase. You must integrate Google Analytics data with Shopify data to obtain this knowledge. The two examples provide a broad outline of the process of data joining.
Joining data from several sources into a single dataset is known as data joining. The method is effective when combining many data sets and at least one common dimension is shared. During advertising campaigns, firms often compile data from a variety of sources. If a company fails to consolidate its data, it will be unable to gauge the efficacy of its marketing initiatives. As a result, the significance of data joining becomes clear. The following are some of the benefits of data blending:
- Aid in making wiser choices
- Identify the critical connection between datasets
- Highlight insightful findings gleaned from many data sets
Why is Data Blending Important?
Combining information from many sources has increased the significance of data blending in today’s businesses. For example, researching marketing often requires extracting information from sources like social media, online stores, and consumer surveys. If you do not combine these datasets, you will not have a complete picture of what is happening. As a result, you will not be able to see the whole picture and make well-informed judgments.
Data blending allows you to understand your consumers’ expectations fully. Indeed, data mixing has broader applications than only in business. Information on:
- Improved therapeutic alternatives because of scientific inquiry.
- Price shifts in stocks benefit investors.
- Predicting environmental changes based on weather trends.
- Maintaining strict security protocols is essential for every successful company.
- Data blending is helpful if you need to combine information from many sources.
Advantages of Data Blending
Now that the basics of data blending are clear let us look at some of the most prevalent justifications for investing in a technology that facilitates smooth data blending.
Speedy Evaluation
When evaluating client data, data collection will typically only provide you with a fraction of the complete picture. To illustrate, say you keep track of monthly sales and quotas in separate databases. A Venn diagram is a valuable tool for blending data. This provides a fresh perspective on the data, from which new insights may be drawn to inform strategic choices.
Fewer Data Silos
Despite the plethora of data at our disposal, most data are still hidden in segregated systems. Data may be kept in distinct streams and blended as needed with the help of blending. This setup allows for greater adaptability and does away with data gaps.
Increased Productivity
Not all data sets benefit most from being joined together. In the first place, joining might make it more difficult to sum data from numerous tables. Additionally, it may be challenging to filter and evaluate data with numerous levels of detail. When data is blended, these complications disappear, making the process smooth and easy.
Not Dependent on Data Scientists
Data blending is accessible to everybody without requiring a data scientist’s level of expertise or even a particular technical background. Non-analytical workers in sales, marketing, and finance might benefit from this approach.
Increased Earnings
The number of companies actively gathering data is growing. But sadly, many people have trouble learning anything useful from their data analyses. Data fails to drive results because information is stored in a database rather than visualized to influence business decisions. If you want to be sure you are basing crucial business choices on accurate information, you need data blending skills, say analysts cited by Alteryx.
Limitations of Data Blending
Missed sales opportunities (37% of the time), reduced return on investment (25% of the time), increased expenditures (18% of the time), and falling behind the competition (9%) are just some of the many negative outcomes that can occur when data blending capabilities are unavailable. Data blending helps escape this trap, providing business analysts with a useful tool for operational analytics and enabling them to make more informed decisions based on data from various sources.
Your data mixing capabilities will be constrained by the capabilities of the ETL tool you choose. For example, a top-notch system will be able to spot damaged and duplicate information. In addition, it will help you keep your data organized before and after you load it to a destination, so you can make better use of both.
Since different methods of blending data have varying degrees of success, it is important to investigate your possibilities. Try to get a free trial or demonstration if you can. Then, by observing the ETL tool in action, you can make a well-informed decision that facilitates the smooth completion of your projects.
Data Blending vs. Data Integration
Merging data and integrating it have many similarities. However, there is a major distinction between the two of them. You already know that data mixing requires collecting information from several sources.
For data integration to work, all the datasets you want to mine must be stored in the same relational database. Using data integration successfully presumes that you will only ever employ a single database. However, when your scope grows to include many databases, you will need to switch to a program that supports mixing data from several sources.
Data Blending and ETL
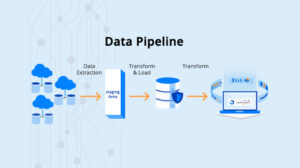
Data mixing is a common use of ETL. Because they allow users to connect to different databases for extraction, ETL systems facilitate data mixing. When data has been extracted, it may be processed using data pipelines. One type of transformation involves rearranging data so that it can be read and understood with less effort. Once ETL has transformed the data, it may load it into a new destination, such as a database or analytics tool.
Avoid making the erroneous assumption that ELT platforms will be equally helpful. For example, despite its advantages, ELT is unsuitable for data blending since it does not convert data from several forms into a single source before loading it. The alternative is ELT solutions, which may store data in several different file types. Furthermore, alterations cannot happen in transit; rather, they must be performed at the destination.
Methods Suitable for Data Blending
Consent When Necessary
Anonymized and publicly available data preclude obtaining consent before its dissemination. However, consent is required when a user has not made the data public or when the user expects that the data has not been made public. As a result, the primary analyst cannot comprehend the subjects’ identities if the secondary analyst is unaware of them. Their consent for the new usage can be obtained by approaching them with an explanation and requesting to re-contact the subjects. A suitable intervention of well-conducted research, as used here.
Data Harmonization
When blending various data sources that contain comparable structures that are divided proportionally, it is vital to harmonize the stages to generate a functioning blended data set. One crucial part of data blending is the creation of new variables to account for the error term and bias for each data source and level, and this happens when more data sets are integrated, and their similarities and differences are about equal.
Logging Information
Once data is blended, it becomes difficult to determine where each component originated. Furthermore, it is important to keep track of where the data came from. In other words, how much information did the original have? Where did you find this information? Where did the variables come from that were utilized to combine or link the data? Where can I see the procedures and parameters that were utilized to generate new variables? To verify the reliability of the data, it is important to keep a detailed record of the steps used to combine the datasets. That is just as important for giving credit where credit is due for the blended data.
Realizing the Importance of Algorithms
With the current volume of data, physical processing is no longer a viable option. If not for accuracy, then at least for the sake of the numbers, computer power is a need. Each employed method presupposes specific characteristics of the underlying data, such as its normal distribution or the presence of a certain skew and its classification. This allows us to evaluate the effect, i.e., parameter sensitivity, of varying the starting parameters and to contrast that with the optimized functions. Knowing only these two features allows us to evaluate the differences between the outcomes of different algorithms.
Test for Fairness
Since models evolve for a feature, they are not designed to detect architectural biases that arise from insufficient, disruptive, or unbalanced training data. Researchers, and especially those in the social sciences who seek generalizability from prediction models, have a duty to supply such details. New standards for measuring fairness are being developed and may be used as a statistical sample of the population to ascertain a range of parameters.
Data Blending Process
Even though there are various methods for blending data, such as inner and outer joins, fuzzy matching, and unions, data blending may be summed up in four easy stages.
Data Preparation
The first thing to do while collecting data is to figure out what information would be useful for answering the problems. One may employ various formats or file types to locate useful datasets from diverse sources. However, all data sources must be comparable along at least one dimension before they may be integrated.
Modern analytics technology can automatically and repeatedly turn disparate kinds into a common framework that allows for a meaningful mix without modifying the original data source.
Data Blending
To guarantee a smooth blending of data from diverse sources, it is recommended to combine them and tailor each join to the common dimension. When doing an analysis, it is important to keep the blended perspective in mind and only include the data that is necessary to answer the questions being addressed. In addition, the final dataset should be straightforward and simple to convey to relevant parties.
Come back to this point to modify the procedure and add or delete data for a deeper dive into the results.
Verifying Outcomes
It is common knowledge that data from many places might introduce several incompatibilities or errors. Verify the outcomes by examining the data, digging into the mismatched records, and ensuring everything adds up consistently. The first step is to prepare the data for analysis. The next step is to inspect the newly created data set to make sure it is of the correct size and type for analysis. The last step is a critical evaluation of the blended product. If there are any mismatched records, now is the time to investigate them and go back to the data preparation steps that came before the mix.
Extraction of Information
When all the hard work of data blending is complete, it is time to put the results into the appropriate business intelligence system so that the blended dataset may aid in achieving the goal. Outputs can be sent back into the database, used in an operational process, examined further with statistical, spatial, or predictive methods, or shown in a tool like PowerBI or Tableau.
Conclusion
Enterprise ETL tools and skilled Data Engineers who can extract maximum performance from data pipelines will still be required, but the arrival of Data Blending technologies presents a new challenge/opportunity for businesses. It is important to equip the business user community with Data Blending technologies to reduce the time it takes to make data-based decisions. The two systems should coexist within a company for the best results, as there is no “one size fits all cases” solution. To ensure uniformity of implementation, it is recommended to broaden the high-level guideline criteria to serve as guard rails for the data consumer community and to be arbitrated by a centralized Architecture Board.
Thanks to data blending, executives can get more granular level data and precise insights. Using Daton, our eCommerce-focused data pipeline, data analysts can load and replicate all these data into a data warehouse of their choice. Then, analysts can join and blend these data sources and create data sets to share with the executives.