Contribution margin is a financial metric that measures the profitability of individual items or product lines by calculating the difference between the sales revenue and the variable costs associated with producing those items. It represents the amount of money a business has left over after covering the variable costs to contribute towards fixed costs and profit.
This metric is useful for determining the most profitable products, making pricing decisions, and evaluating the overall financial health of a business.
Calculating Contribution Margin
The formula for calculating contribution margin is:
Contribution Margin = Sales Revenue – Variable Costs
To calculate the contribution margin, follow these steps:
1. Determine the sales revenue: Identify the selling price of the product or service and multiply it by the number of units sold.
Sales Revenue = Selling Price per Unit × Number of Units Sold
2. Calculate the total variable costs: Variable costs are expenses that change in direct proportion to the volume of goods produced or services rendered. Examples of variable costs include raw materials, direct labor, and sales commissions. Identify all variable costs associated with the product or service and multiply them by the number of units produced or services rendered.
Total Variable Costs = Variable Cost per Unit × Number of Units Produced
3. Subtract the total variable costs from the sales revenue to find the contribution margin:
Contribution Margin = Sales Revenue – Total Variable Costs
The contribution margin represents the amount of money a business has left over after covering the variable costs to contribute towards fixed costs and profit. This metric can be calculated on a per-unit basis or for a group of products or services.
Difference between Contribution Margin and Gross Margin
Gross margin, on the other hand, calculates the difference between sales revenue and the cost of goods sold (COGS), which includes both fixed and variable production costs.
Here’s a simple example to illustrate the difference between contribution margin and gross margin:
Suppose a company sells a product for $50, and the variable cost per unit is $20. The fixed production costs are $10,000 per month.
Contribution Margin: Sales Revenue per unit – Variable Cost per unit
$50 – $20 = $30
In this case, the contribution margin per unit is $30, which represents the amount contributed towards covering fixed costs and generating profit.
Gross Margin: Now let’s calculate the gross margin. Assume the company produces and sells 1,000 units per month.
Total Sales Revenue: 1,000 units * $50 = $50,000
Total Variable Cost: 1,000 units * $20 = $20,000
Total Fixed Cost: $10,000
COGS (Cost of Goods Sold): Total Variable Cost + Total Fixed Cost $20,000 + $10,000 = $30,000
Gross Margin: (Total Sales Revenue – COGS) / Total Sales Revenue
($50,000 – $30,000) / $50,000 = 0.4 or 40%
The gross margin is 40%, which indicates that 40% of the sales revenue remains after accounting for the production costs.
In summary, the contribution margin focuses on the relationship between sales revenue and variable costs, while the gross margin considers both fixed and variable production costs in its calculation.
Contribution Margin Ratio
Contribution Margin Ratio (CMR) is a financial metric that expresses the contribution margin as a percentage of sales revenue. It indicates the proportion of each dollar in sales revenue that is available to cover fixed costs and contribute to profit after accounting for variable costs. The formula for calculating Contribution Margin Ratio is:
Contribution Margin Ratio = (Contribution Margin / Sales Revenue) × 100
To interpret the Contribution Margin Ratio:
A higher CMR means that a larger portion of each dollar in sales revenue contributes to covering fixed costs and generating profit. A lower CMR indicates that a smaller portion of each dollar in sales goes towards covering fixed costs and profit, with a higher proportion being consumed by variable costs.
Interpreting Contribution Margin Ratio and Gross Margin together:
- Comparing the two metrics can provide insights into a company’s cost structure and production efficiency. If the CMR is significantly higher than the Gross Margin, it may indicate that fixed costs are a large portion of the total costs, which can impact profitability.
- A consistently high CMR and Gross Margin indicate strong profitability, while low values for both metrics may signal potential issues with pricing, production efficiency, or cost management.
- Comparing CMR and Gross Margin across different products, product lines, or divisions within a company can help identify areas with higher profitability and those that may require improvements in cost management or pricing strategies.
By analyzing both Contribution Margin Ratio and Gross Margin, businesses can gain a deeper understanding of their cost structure, production efficiency, and overall profitability, enabling them to make informed decisions to optimize their financial performance.
Contribution Margin and Break-Even Analysis
The break-even point is a financial concept that represents the level of sales at which a business’s total revenue equals its total costs. In other words, it’s the point where a company neither makes a profit nor incurs a loss. The break-even point is a critical metric in understanding the financial viability of a business, as it helps determine the minimum sales volume required to cover all costs.
Using Contribution Margin to Calculate the Break-Even Point:
Break-Even Point (Units) = Total Fixed Costs / Contribution Margin per Unit
Break-even analysis is crucial in business decision-making for several reasons:
- Cost Management: By understanding the break-even point, businesses can identify areas where they can reduce costs or increase efficiency to lower the break-even point and improve profitability.
- Pricing Decisions: Break-even analysis helps companies set the right prices for their products or services to ensure they cover all costs and achieve their desired profit margins.
- Evaluating Business Opportunities: Break-even analysis can be used to assess the viability of new product launches, expansion plans, or investments by estimating the sales volume required to cover costs and generate profit.
- Financial Planning: Knowing the break-even point assists in budgeting and financial planning, as it highlights the minimum sales targets that must be met to sustain the business.
P&L Report Template
Below is a sample P&L (Profit and Loss) template for an eCommerce business selling on multiple channels, incorporating the contribution margin, CAC, and LTV calculations:
| Category | Channel A | Channel B | Channel C | Total |
| Sales Revenue | $A_Revenue | $B_Revenue | $C_Revenue | $Total_Revenue |
| Variable Costs | $A_Variable | $B_Variable | $C_Variable | $Total_Variable |
| Contribution Margin | $A_CM | $B_CM | $C_CM | $Total_CM |
| Fixed Costs | $Total_Fixed | |||
| Gross Profit | $Total_Gross | |||
| Operating Expenses | $Total_Operating | |||
| Marketing Expenses | $A_Marketing | $B_Marketing | $C_Marketing | $Total_Marketing |
| New Customers Acquired | A_NewCustomers | B_NewCustomers | C_NewCustomers | Total_NewCustomers |
| Customer Acquisition Cost | $A_CAC | $B_CAC | $C_CAC | $Total_CAC |
| Customer Lifetime Value | $A_LTV | $B_LTV | $C_LTV | $Total_LTV |
| Net Profit | $Total_Net |
To complete the template:
- Fill in the sales revenue, variable costs, marketing expenses, and new customers acquired for each channel.
- Calculate the contribution margin for each channel by subtracting variable costs from sales revenue.
- Calculate the total values for each category by summing up the respective amounts from each channel.
- Calculate the gross profit by subtracting the total fixed costs from the total contribution margin.
- Calculate the net profit by subtracting the total operating expenses from the total gross profit.
- Compute the Customer Acquisition Cost (CAC) for each channel by dividing the marketing expenses by the number of new customers acquired.
- Calculate the Customer Lifetime Value (LTV) for each channel based on your business’s specific LTV formula. This typically includes factors such as average revenue per customer and average customer lifetime.
This template allows you to analyze the financial performance of your eCommerce business across multiple channels, making it easier to identify areas for improvement and make informed strategic decisions.
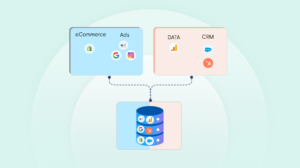
Modern Data Stack & Daily Automated P&L
For an e-commerce brand that sells on multiple channels and generates more than $10 million in annual revenue, daily automated profit and loss (P&L) statements are of paramount importance. There are several reasons why this is the case:
- Real-time financial insights: With daily automated P&L statements, management can access real-time financial data, which allows them to make informed and timely decisions. This is crucial for reacting to market trends, inventory levels, and other business factors that impact revenue and costs.
- Efficient cash flow management: Accurate and up-to-date P&L information helps businesses to manage their cash flow more effectively. By tracking daily revenue and expenses, they can identify potential cash shortfalls or surpluses and respond accordingly to ensure financial stability.
- Channel performance evaluation: When selling on multiple channels, it’s essential to monitor and compare the performance of each channel. Daily P&L statements enable businesses to assess the profitability of each channel and allocate resources accordingly, optimizing their marketing and sales strategies.
- Cost control and optimization: Regular P&L updates allow companies to identify areas where costs may be increasing, enabling them to take corrective action before expenses spiral out of control. This proactive approach to cost management contributes to overall profitability.
- Enhanced decision-making: Daily P&L data offers valuable insights into product performance, customer behavior, and sales trends. This information is essential for making strategic decisions, such as adjusting pricing, launching promotions, and expanding or discontinuing product lines.
- Improved risk management: Regular P&L monitoring helps businesses identify potential financial risks, such as declining sales or rising expenses. Early detection enables them to take appropriate action to mitigate these risks and protect their bottom line.
Technology has played a crucial role in streamlining financial processes and automating daily tasks such as generating profit and loss statements. The modern data stack has revolutionized the way companies manage their finances, making it easier and faster to track and analyze financial data.
One key area where technology has been particularly helpful is anomaly detection. With the ability to automatically track and flag anomalies, companies can quickly identify and address potential issues before they become major problems.
In addition, technology has enabled companies to gain better visibility into their marketing return on investment (ROI). By collecting and analyzing data from multiple sources, including social media, website traffic, and advertising campaigns, companies can gain a more comprehensive understanding of how their marketing efforts are impacting their bottom line.
Overall, the modern data stack has allowed companies to operate more efficiently and effectively by providing real-time access to critical financial information and automating repetitive tasks. As technology continues to advance, we can expect to see even more innovation in this area, enabling companies to further streamline their financial processes and gain even greater insights into their operations.
Conclusion
The importance of contribution margin and profitability analysis cannot be overstated, as they play a crucial role in a business’s success. Understanding these metrics allows companies to make informed decisions about their operations, investments, and marketing strategies.
Saras Analytics, a trusted data partner, has been instrumental in helping brands manage their data operations and conduct growth analytics. By leveraging their expertise and the power of the modern data stack, businesses can gain valuable insights, streamline financial processes, and ultimately drive growth and profitability.